Why quality matters
World leader in the science of quality for infectious disease testing
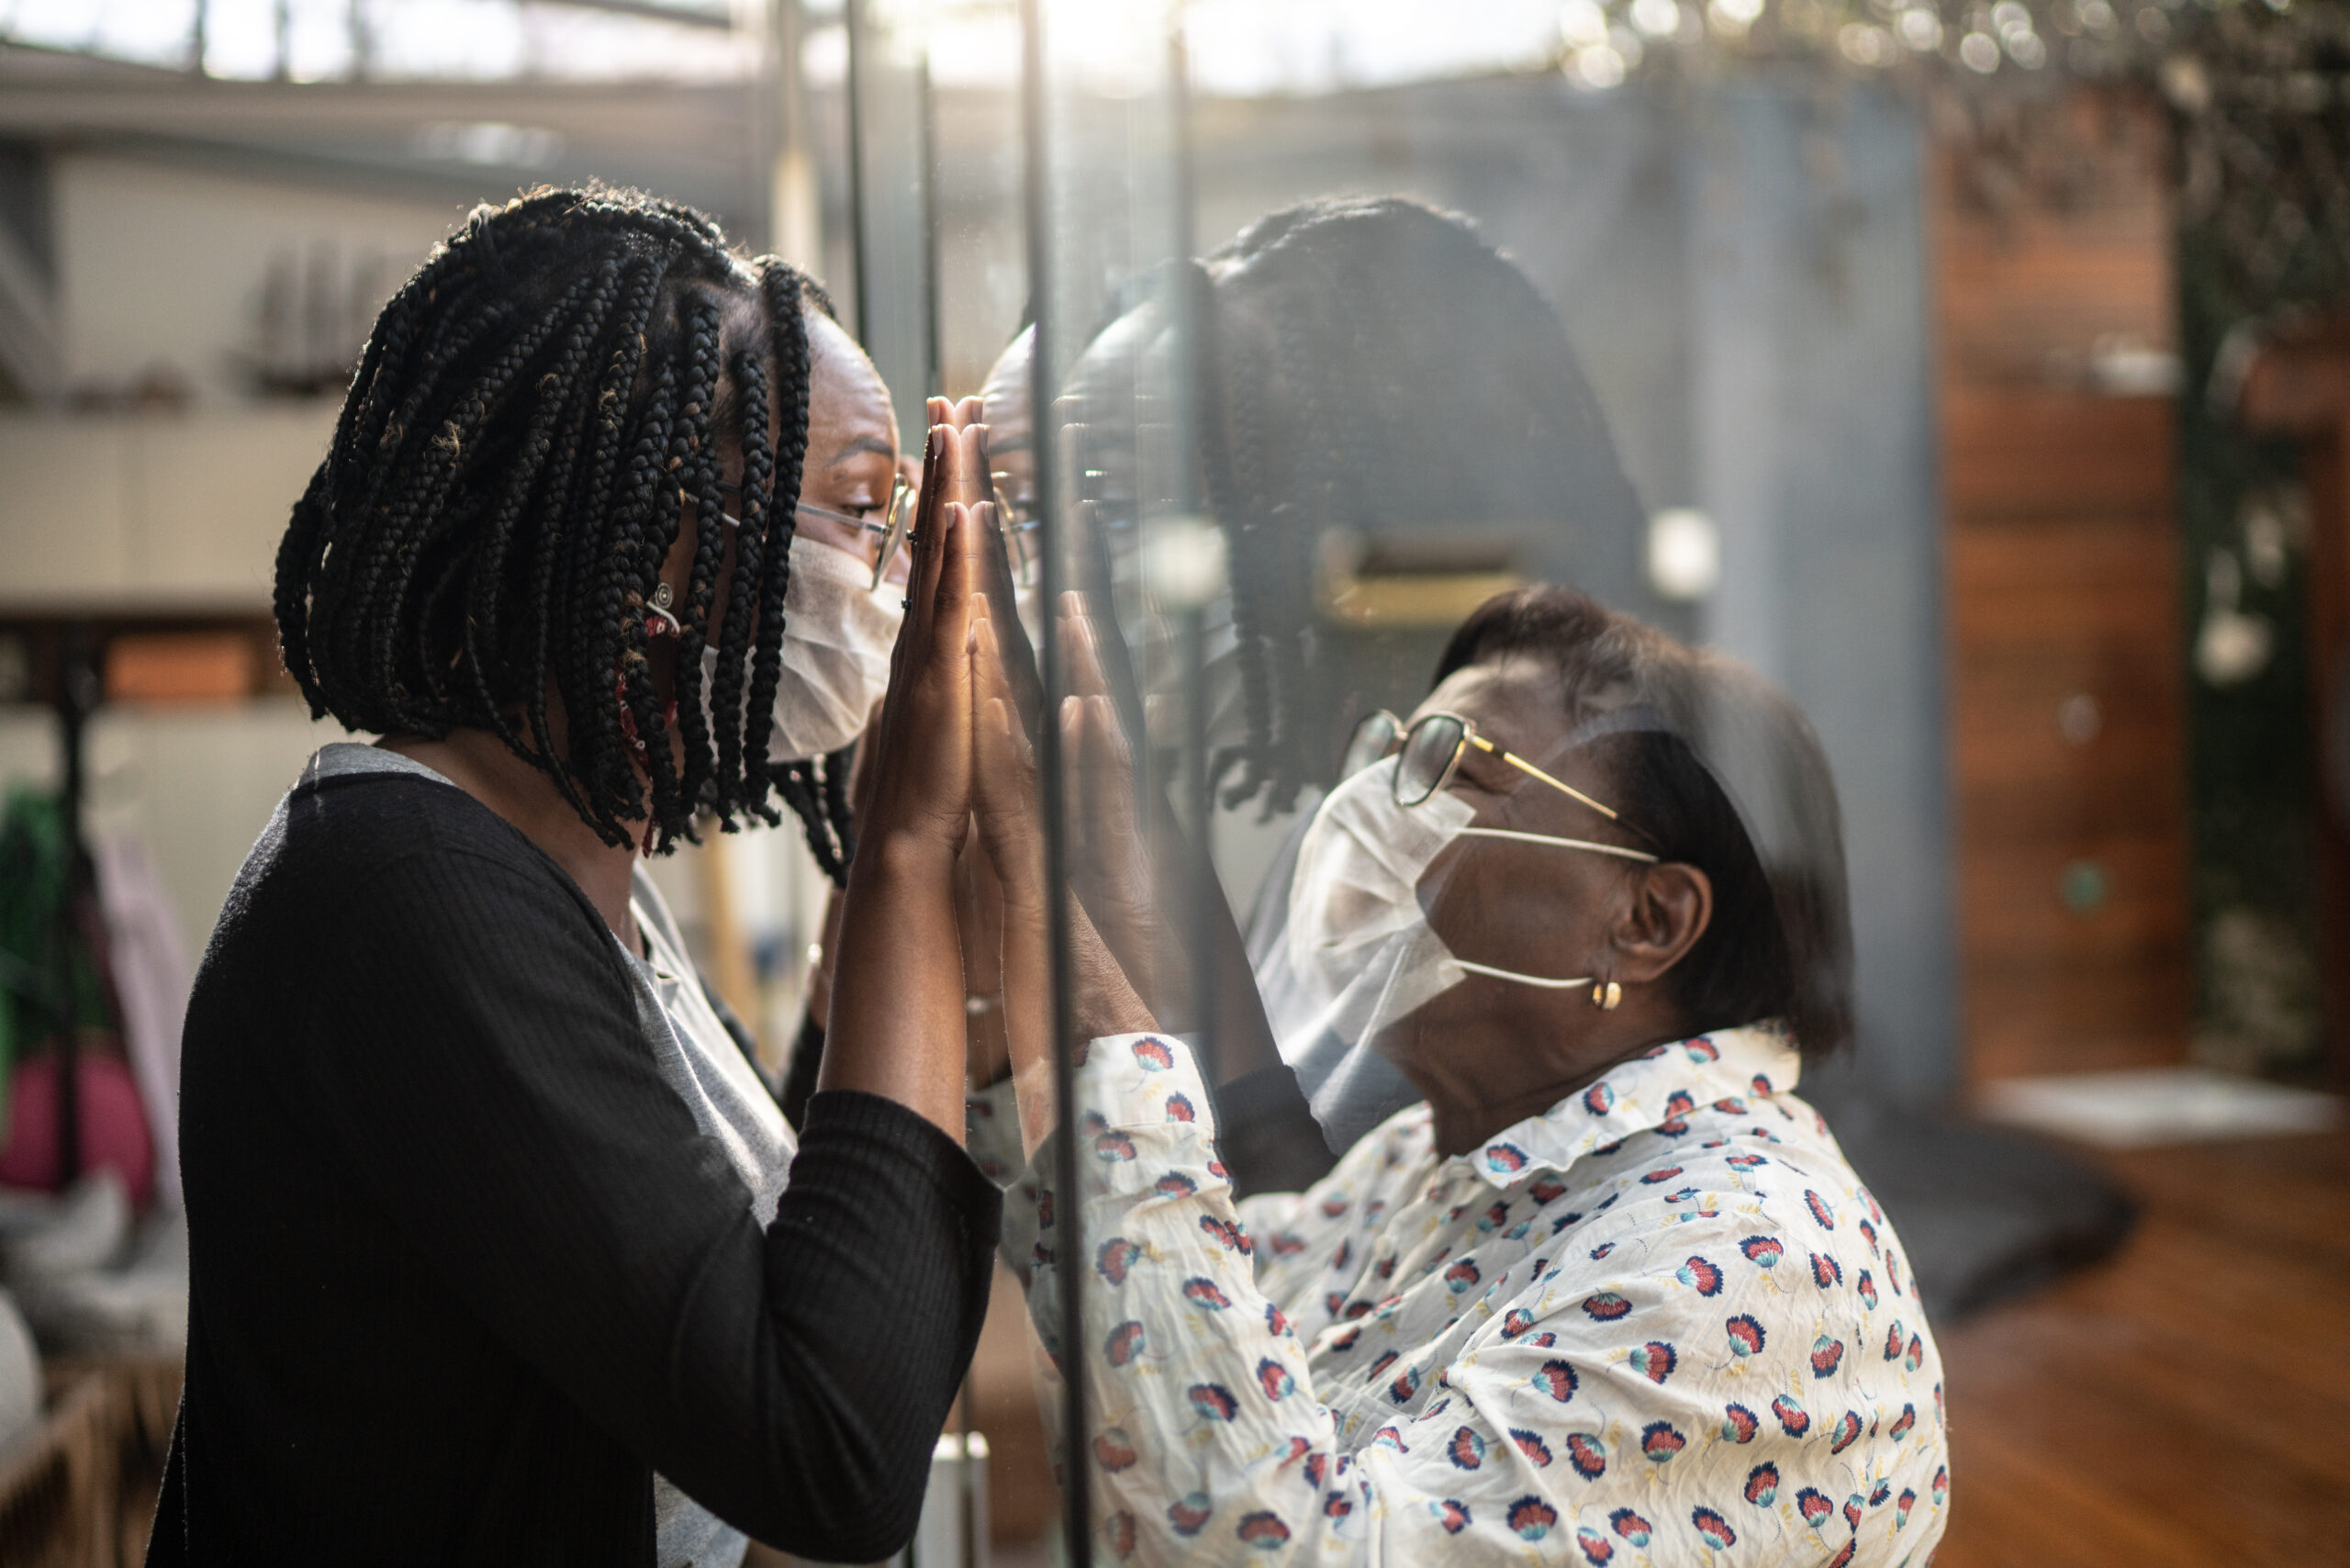
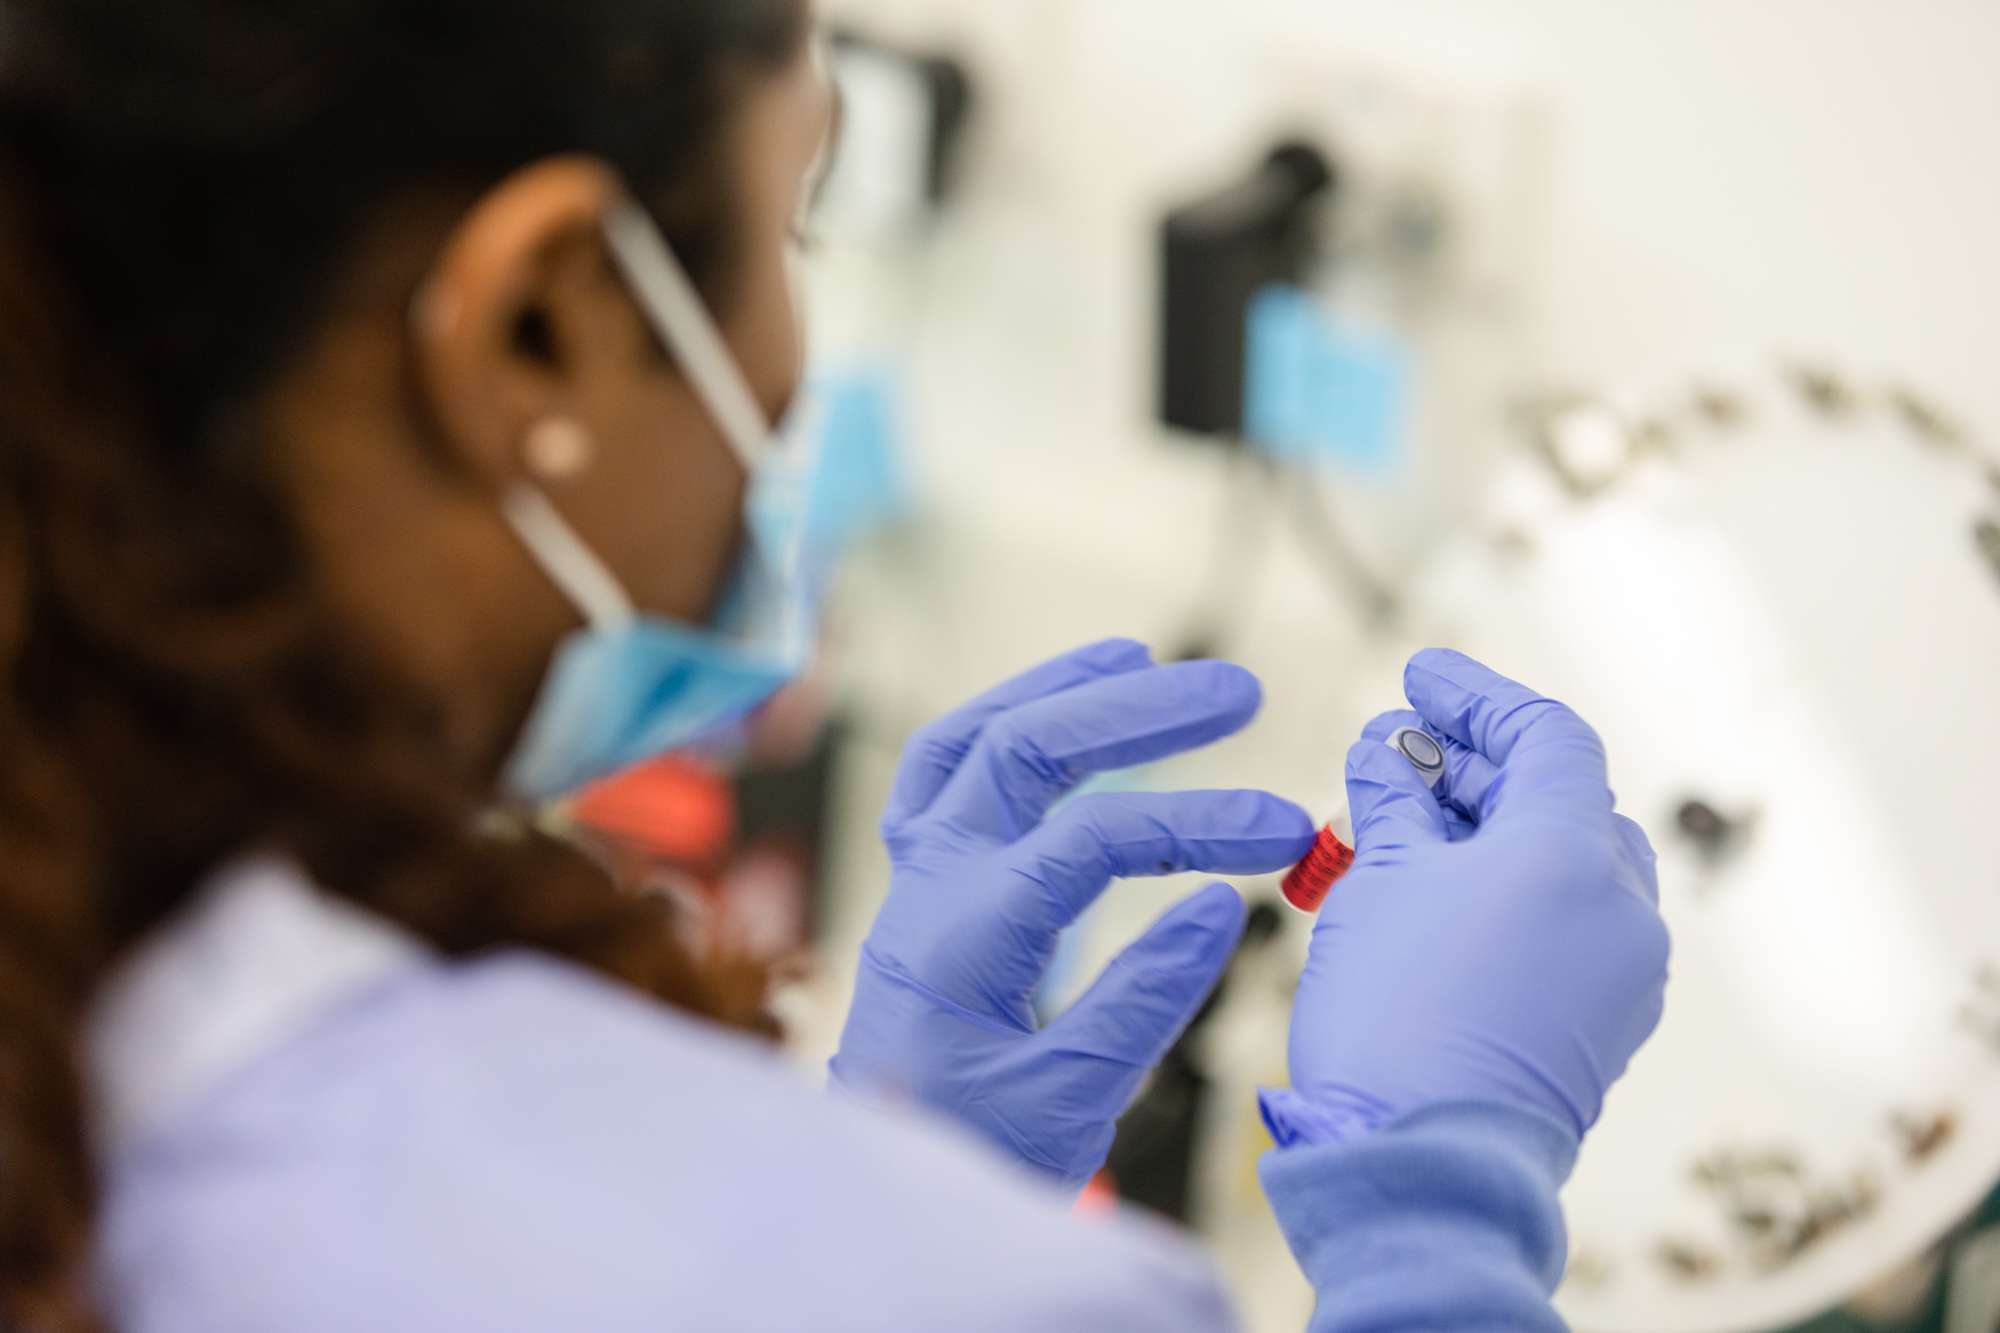
Every day around the world, millions of people are tested for infectious diseases – including influenza, Hepatitis, HIV and COVID-19.
Keeping us all safe and connected relies on the accuracy of this testing.
NRL is a global leader in the science of quality for infectious disease testing. We support laboratories in more than 70 countries to ensure that their results are accurate, consistent and reliable.
From a new laboratory in London, to a point-of-care test in Mongolia, from a blood bank in Manila to a public laboratory in Melbourne – NRL’s mission is to create healthy communities across the globe, through supporting accurate, high-quality infectious disease testing.
Products and services
Explore what we offer

Testing Services
TGA licensed screening of blood and tissue donors, reference testing; and contract testing for projects.
Consulting and Training
Customised and sustainable training to enhance quality of infectious disease testing through education, advocacy and mentorship.
Biobank
The SVI Biobank is a storage resource and repository for research groups, clinical trials organisations and others requiring contract storage...
Research and Development
NRL Research and Development provides custom services, to enable new ideas and products to be brought to market.
Point of Care Quality Assurance
Programs designed to ensure the quality of infectious disease testing through Point of Care QA.
Quality Control Services
Comprehensive Quality Control Services providing samples, software and associated services to monitor the precision and accuracy of test results.
EQAS
Ensure the effectiveness and reliability of tests and testing processes with NRL EQAS Proficiency programs.
Evaluations
Discover NRL Evaluations: Your trusted source for independent assessment of in vitro diagnostic devices (IVDs). Benefit from tailored validation and...
Our Story
NRL - designated as a WHO Collaborating Centre in 1985
Australia’s National (Serology) Reference Laboratory (NRL) was first established as part of the Australian Government’s HIV and AIDS strategy in 1985 and later that year was designated as a World Health Organisation (WHO) Collaborating Centre for Diagnostics and Laboratory Support for HIV and AIDS and other Blood-borne Infections.
Featured posts
The latest from NRL Quality
February 2024
Research & Development: HTLV Longitudinal Study
February 2024
Scientific Consulting and Training: Indonesia Training 2024
November 2023
EQAS Updates
Partnerships
We partner with global leaders in our field